Emerging Markets: Headwinds Abating?
After a decade of U.S. equity market outperformance, the global investment landscape appears to be shifting. U.S. equities have reached historically elevated valuations and record concentration levels, while global investors remain underexposed to emerging markets (“EM”). Meanwhile, EM earnings momentum is improving, currencies remain broadly undervalued, and policymakers retain room to support growth, leaving the asset class fundamentally appealing while structurally under-owned.
Moreover, rapid technological progress and surging consumer demand are reshaping the growth trajectory of emerging market economies. With further support from improved governance and greater shareholder discipline, the opportunity set looks distinctly different from the recent past. For patient and selective investors, the next phase of global equity leadership could be forming where expectations remain muted. After more than a decade of U.S. leadership, several conditions that often precede a rotation in market leadership are beginning to align to favor EM.
Valuation, Currency and Earnings Momentum Advantages
U.S. equities currently trade at around 23× forward earnings—well above their 30-year average of 17× and comparable to previous peaks in 1999–2000 and 2020. Historically, starting valuations in the top decile have delivered an average of only ~4% annualized returns over the subsequent decade1. Recently, relative performance trends have started to shift: equal-weighted U.S. indices have lagged global peers since 2023, rising 8% year to date, while EM has advanced over 32% this year.
Despite the rebound, EM valuations remain attractive across multiple metrics. On cyclically adjusted earnings, EM trades at roughly half the multiple of the S&P 500—a gap near historic extremes. Since 2015, U.S. earnings per share have doubled, largely driven by stock buybacks, margin expansion, and a strong dollar rather than organic growth. In contrast, while local profits and GDP in EM have grown, company earnings look muted in dollar terms because of currency headwinds and (a lack of) buyback effects. Such an imbalance is unlikely to endure.
Chart 1: EM Equity Valuations vs. DM Near 20-Year Lows2

Currency dynamics provide another potential source of support for EM equities, though timing remains uncertain. Many EM currencies still trade below fair value3, which has depressed local earnings growth in dollar terms. While these imbalances can be long-lived, even a modest stabilization or appreciation in exchange rates could enhance returns.
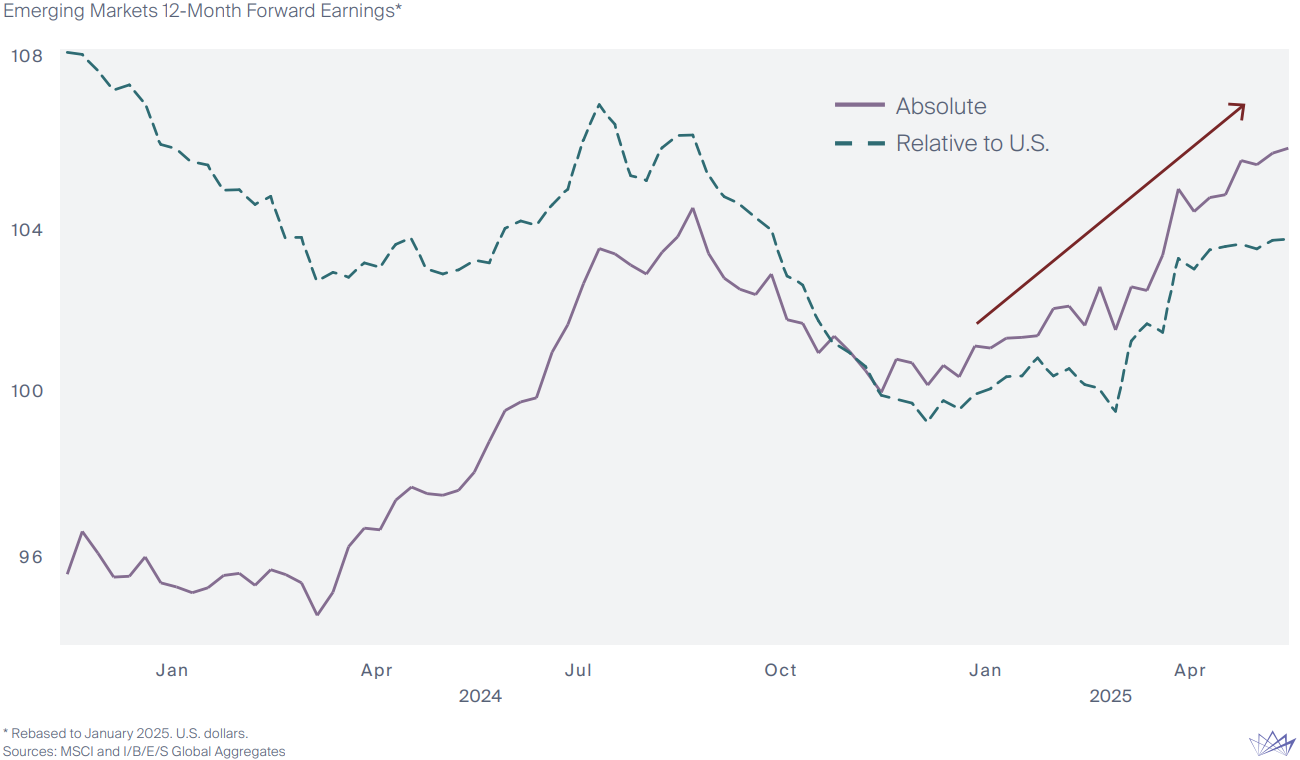
Earnings momentum is also beginning to favor EM. Forward earnings estimates for EM corporates have been rising through 2025, outpacing the U.S. for the first time in more than a decade. This improvement is broad-based, spanning regions and sectors. By contrast, U.S. equity gains since late 2022—roughly $25 trillion in added market capitalization—have been heavily concentrated in a small group of large-cap AI beneficiaries, heightening exposure to a single theme.
Chart 2: EM Earnings Outperforming U.S.
Taken together, today’s indicators—reasonable valuations, improving earnings trends, and undervalued currencies—point to a more balanced outlook. While none of these factors have historically guaranteed a reversal, collectively they suggest that a period of relative catch-up for emerging markets could be underway.
Under-owned, Underappreciated
While fundamentals are improving and valuations are compelling, investors’ allocations still tell a story of hesitation. Global investor allocations remain heavily skewed toward U.S. assets, leaving EM structurally underrepresented. Cumulative flows to EM equities have only recently turned positive after years of outflows, and ownership levels remain near multi-decade lows.
Chart 3: Emerging Market Equity Fund Flows: Annual and Cumulative Trends (2001–2025)4

The persistence of this underweight exposure has left EM like a coiled spring—compressed and ready to release energy as inflows return. Even a modest reallocation by global investors could provide support for EM assets as capital gradually rotates toward undervalued regions. This type of asymmetry creates an appealing setup for investors willing to take a contrarian view.
Changing Opportunities Across the EM Landscape
Importantly, the opportunity in emerging markets is not limited to valuation normalization or recovery of sentiment. The structure of the economies themselves has evolved—industry leadership, governance standards, and growth drivers have strengthened, creating a more resilient and diversified investment landscape than in prior cycles.
China: From Capital Preservation to Selective Risk-Seeking
China’s market dynamic is showing signs of change. Following a prolonged period of investor caution, attention has shifted from fear of capital flight toward the sustainability and efficiency of corporate profits. Recent macro data points to a stabilized economy, supported by moderate fiscal stimulus and recovering consumption. While corporate profitability remains compressed, it is showing signs of improvement as competition moderates and industrial policy places greater emphasis on return discipline following regulators’ anti-involution initiative.
China’s progress in AI also merits attention. Despite chip restrictions, Chinese platforms are narrowing performance gaps in key benchmarks and monetizing across cloud, advertising, gaming, and fintech—often at significantly lower costs than global peers. Ample and relatively inexpensive electricity further strengthens the foundation for growth in digital infrastructure, while related sectors such as electric vehicles and robotics reinforce China’s position as a global manufacturing and innovation hub.
India: A Broadening Growth Engine
India’s structural growth story continues to build momentum. Favorable demographics, a deep pool of STEM talent, and rising middle-class consumption underpin a durable domestic demand base. High real savings rates—above 30% of GDP—support local investment and give policymakers scope to sustain infrastructure and technology spending.
The country’s technology ecosystem is also expanding. With over one billion smartphones now functioning as AI-capable devices, domestic demand for semiconductors and cloud infrastructure is rising. This combination of scale, consumption, and digital capability positions India as one of the more resilient and self-sustaining growth stories among emerging economies.
A Modern, Disciplined, and Shareholder-Focused EM
Beyond the large economies, the broader EM equity universe has undergone a significant transformation as well. Information technology and consumer sectors now comprise about 45% of the EM benchmark—nearly double their share in 2000—while dependence on “old economy” sectors such as commodities has steadily declined. The result is an EM economy increasingly defined by innovation, domestic consumption, and capital efficiency rather than by external liquidity cycles or export surges.
Another defining feature of today’s EM landscape is policy discipline. Many governments have restored fiscal and monetary orthodoxy—running primary surpluses, easing currency controls, and rebuilding reserves. Argentina delivered a fiscal adjustment equal to 6% of GDP in a single quarter and posted its first surplus since 2011; Turkey’s total reserves reached $173 billion as of February 2025, exceeding $100 billion for the first time in eight years; Egypt has advanced FX reforms—including currency unification, liberalization, and tighter macro policy—to bolster currency credibility. By contrast, developed markets remain fiscally lax, with U.S., U.K., and French deficits near post-war highs. Once viewed as profligate, EM is now the steward of austerity, underscoring rising credibility and resilience.
Chart 4: EM Central Banks Still Have Room to Ease
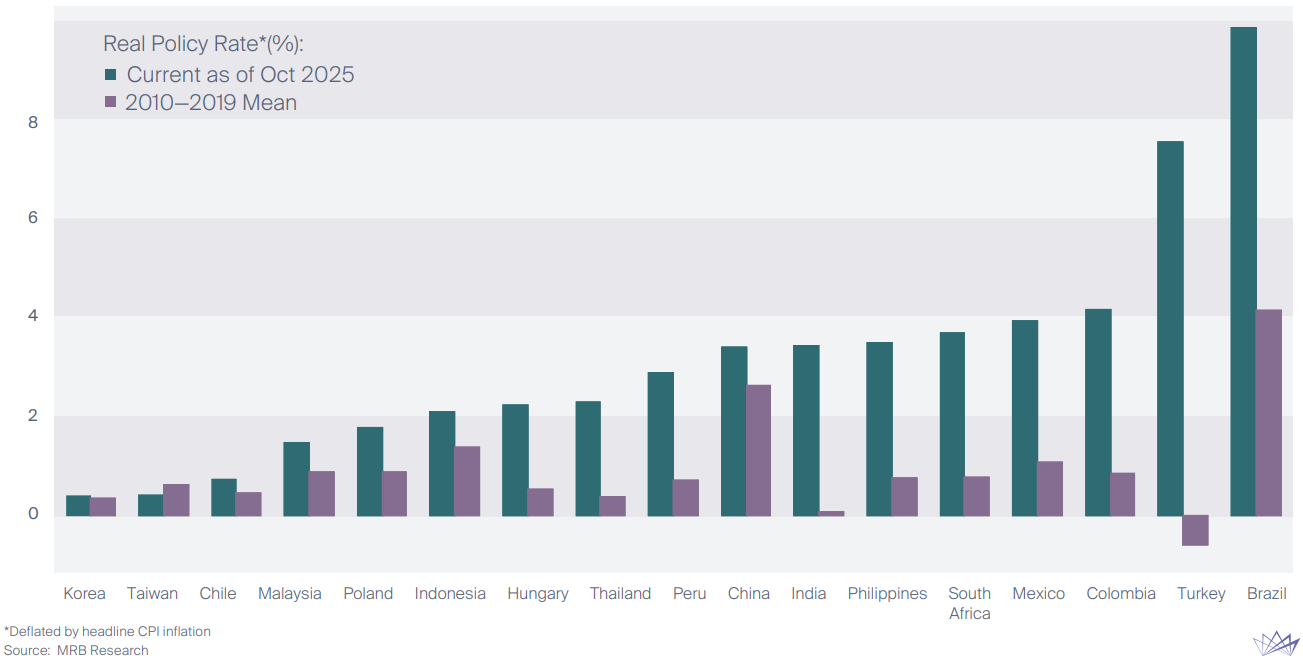
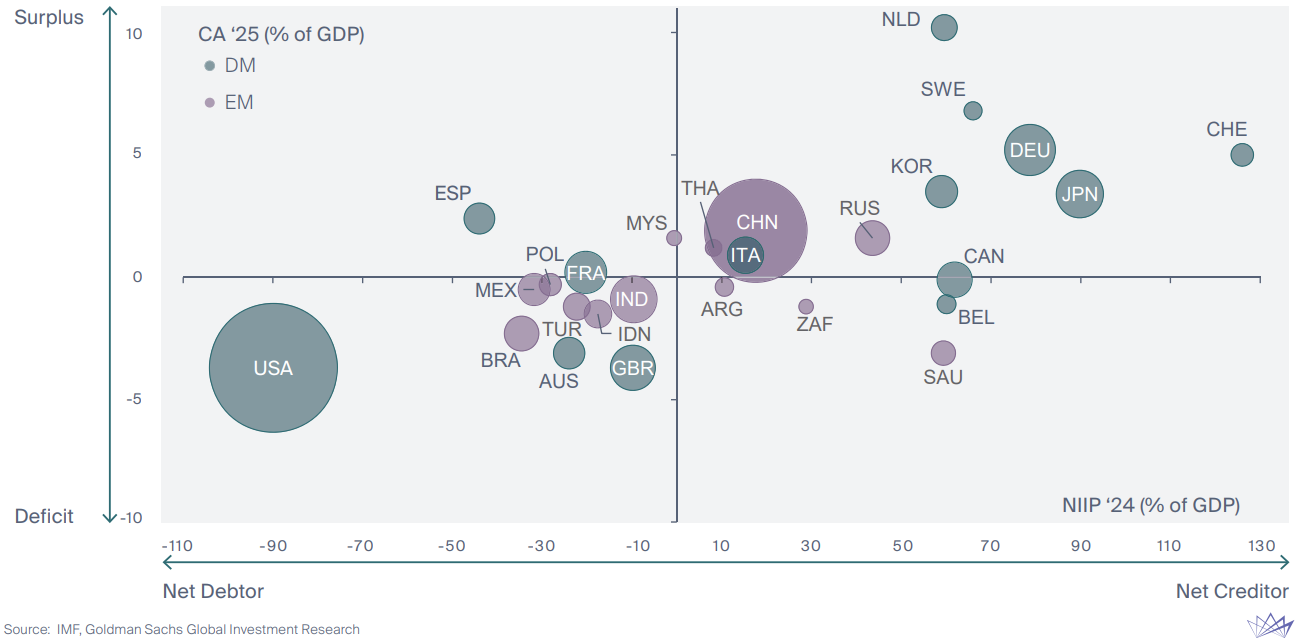
Chart 5: External Imbalances Remain Concentrated in Developed Markets (DMs)5
Shareholder returns are also improving. For example, Korea, Brazil, and Mexico have all seen governance reforms translating into higher payout ratios. The result is a market less dependent on foreign capital inflows and anchored more in domestic profitability, operational efficiency, and sustainable shareholder returns.
A Differentiated Approach for EM Investing
The breadth of opportunity across EM continues to expand but capturing it requires focus and discipline. Broad index exposure can be a blunt instrument for its heavy concentration in three countries and structural underweights to SMIDs, domestic-demand winners, and new-economy sectors that are driving the bulk of EM earnings growth.
Gresham’s approach emphasizes selectivity. We look for concentrated, benchmark-agnostic exposure to investor-friendly, cash-compounding businesses and markets where capital-return cultures are improving. We avoid low quality state-owned companies and overlook financial engineering that flatters reporting optics unsustainably. When executed well, investment alpha in EM stems from valuation discipline—investing in normalized earnings power rather than market narratives—as well as selective country positioning, bottom-up stock selection, and patience for re-ratings to materialize. Ultimately, it is this selectivity, backed by patience and discipline, that defines Gresham’s approach to compounding return over time.
Bottom Line: The Asymmetry Ahead
Emerging markets are entering an increasingly appealing period with favorable valuations, fundamentals, and policy environment. The backdrop of easing inflation in developed markets and a stabilizing or even weakening U.S. dollar turns prior headwinds into tailwinds. Add to this mix improving governance and capital allocation practices, and we have a recipe that should entice sidelined investors to revisit these markets.
Footnotes
1 Based on 10-year annualized total returns of S&P 500 from historical PER deciles 1926 to 2024. Source: Tekne Capital.
2 EM: MXEF Index (MSCI EM) – composite measure of 3 valuation metrics: price/book, price/sales, price/earnings
DM: MXWO Index (MSCI World) – composite measure of 3 valuation metrics: price/book, price/sales, price/earnings
Valuation differential calculated as quotient of DM and EM valuation metrics.
3 Real Effective Exchange Rate (REER) 10-year Z-Score.
4 Excludes onshore funds.
5 Current Account (CA): A positive current account implies the country saves more than it invests (running a surplus). A negative current account implies it spends more than it saves (running a deficit).
Net International Investment Position (NIIP) measures a country’s net foreign assets — assets held abroad minus liabilities to foreigners. A positive NIIP means the country is a net creditor (it owns more abroad than foreigners own of it). A negative NIIP means it is a net debtor.
Data labels in the figure use International Organization for Standardization country codes.
Bubble sizes are proportional US dollar GDP.
Gresham Partners, LLC is an investment adviser registered with the Securities and Exchange Commission (“SEC”). Registration with the SEC alone does not imply a certain level of skill or training. This presentation is for informational purposes only and is not intended to provide investment or tax advice. Gresham Partners, LLC does not provide tax, legal, or accounting advice.